Machine Learning: Decision Trees & Random Forests
Announcements
- Assignment 7: Due Wednesday May 18th
Decision Trees
- Last time we looked at the naive Bayes classifier and k-Nearest Neighbors (kNN) classifier
- Let's look at one other type of classifier
- The decision tree classifier is another common type of classifier
- Simple
- Intuitive
- Works well in many scenarios
- Is explicable
Explicability
- A big challenge in the era of ML and AI is explicability & interpretability
- Why do predictive models behave the way they do?
- If we can't understand how a model works, how do we know if it works?
Supervised learning algorithms are being used for crucial decision-making:
Explainable algorithms...
- can be more easily audited
- facilitate trust
- are easier to debug
- make hidden bias more obvious
- ...but are not a silver bullet!
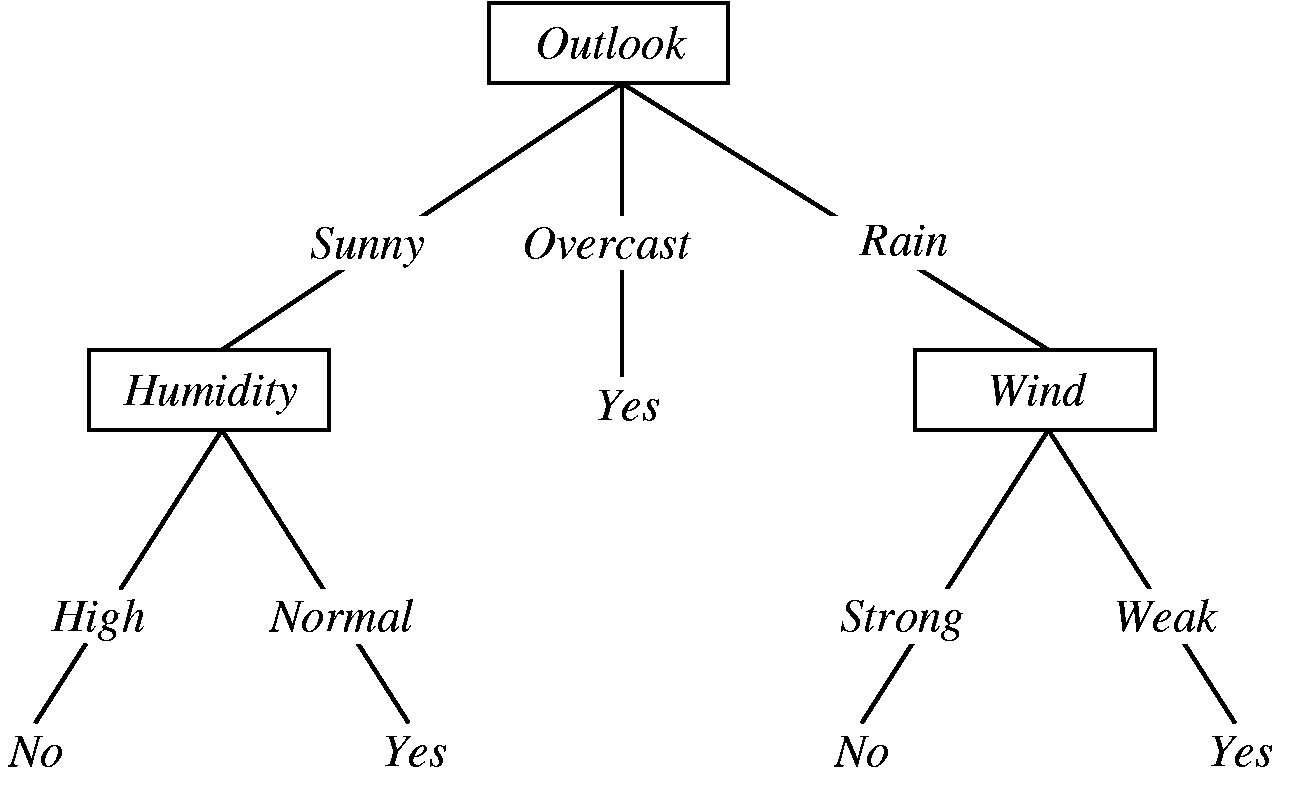
Decision trees mirror how humans approach decision-making:
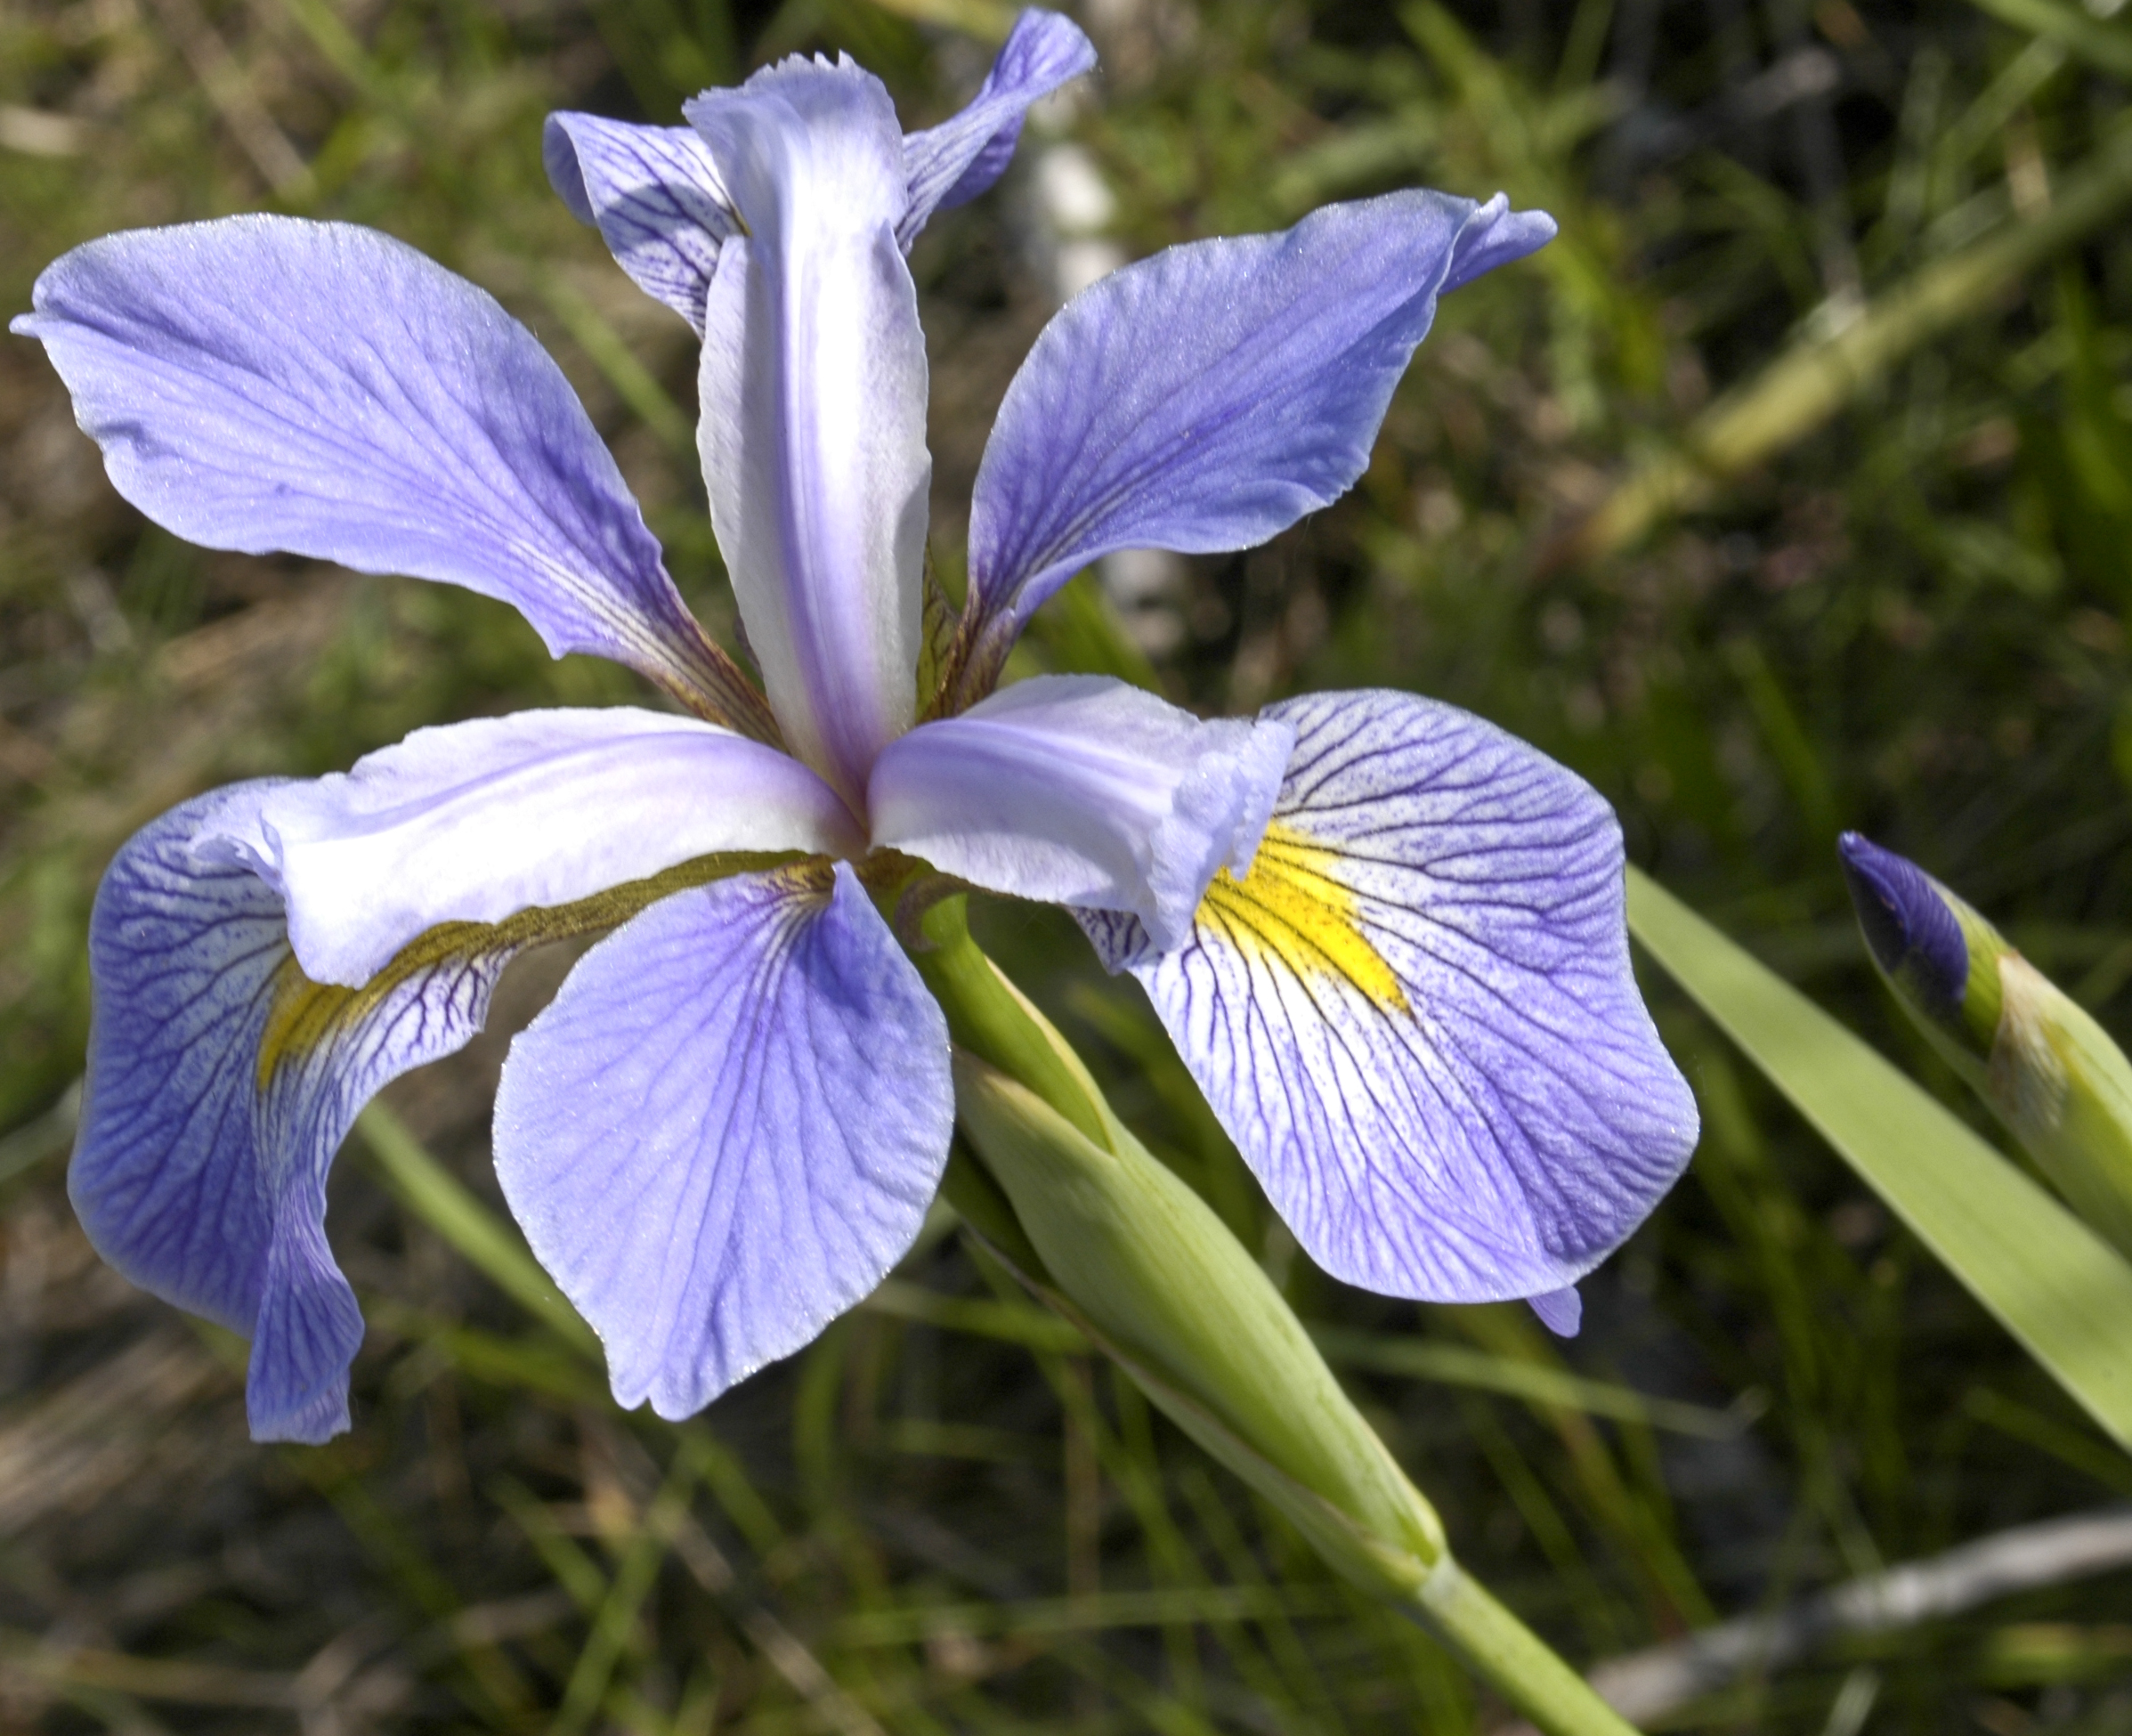
Remember those irises?
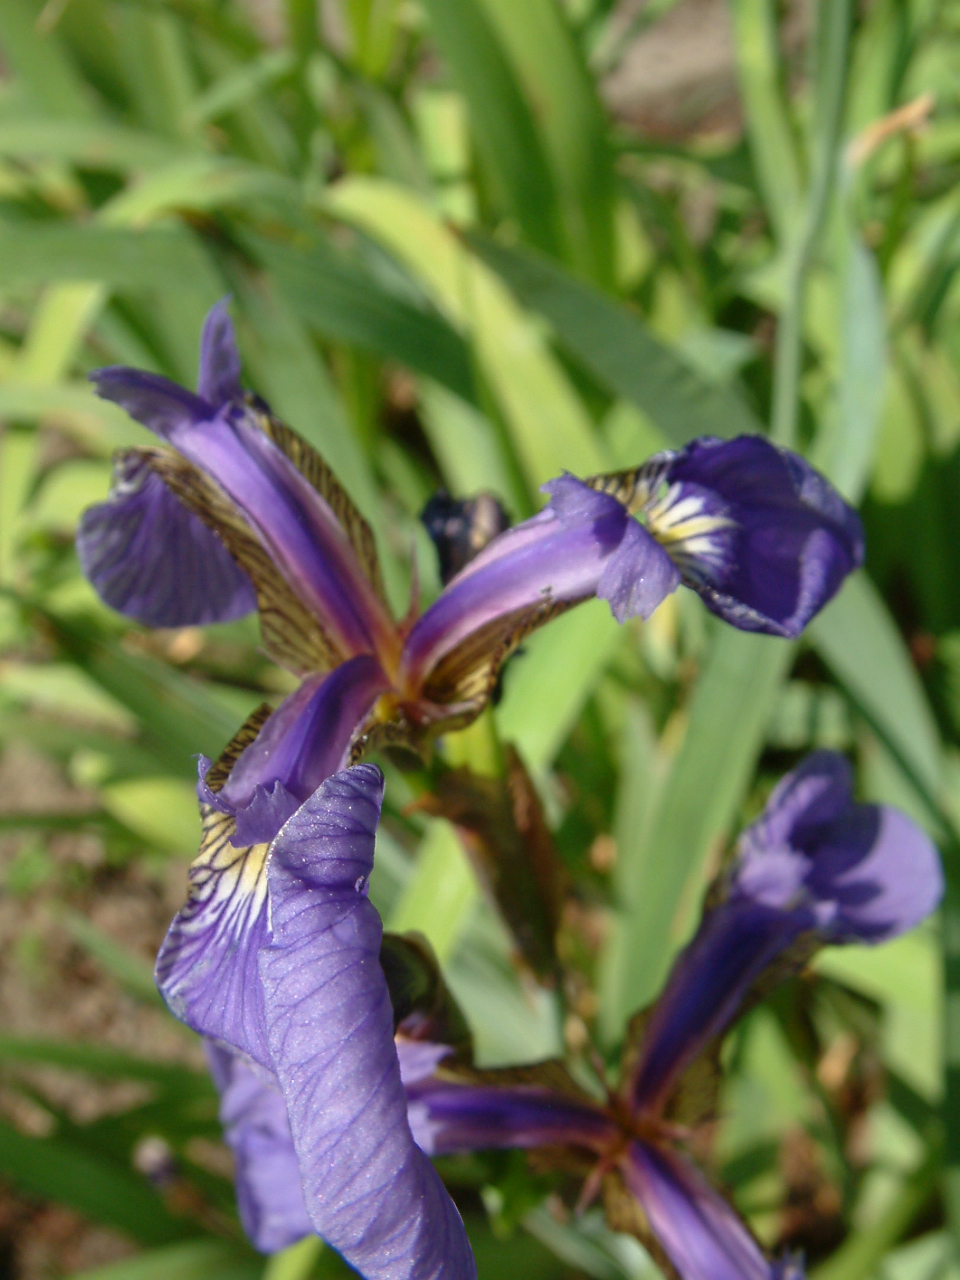 Iris Setosa
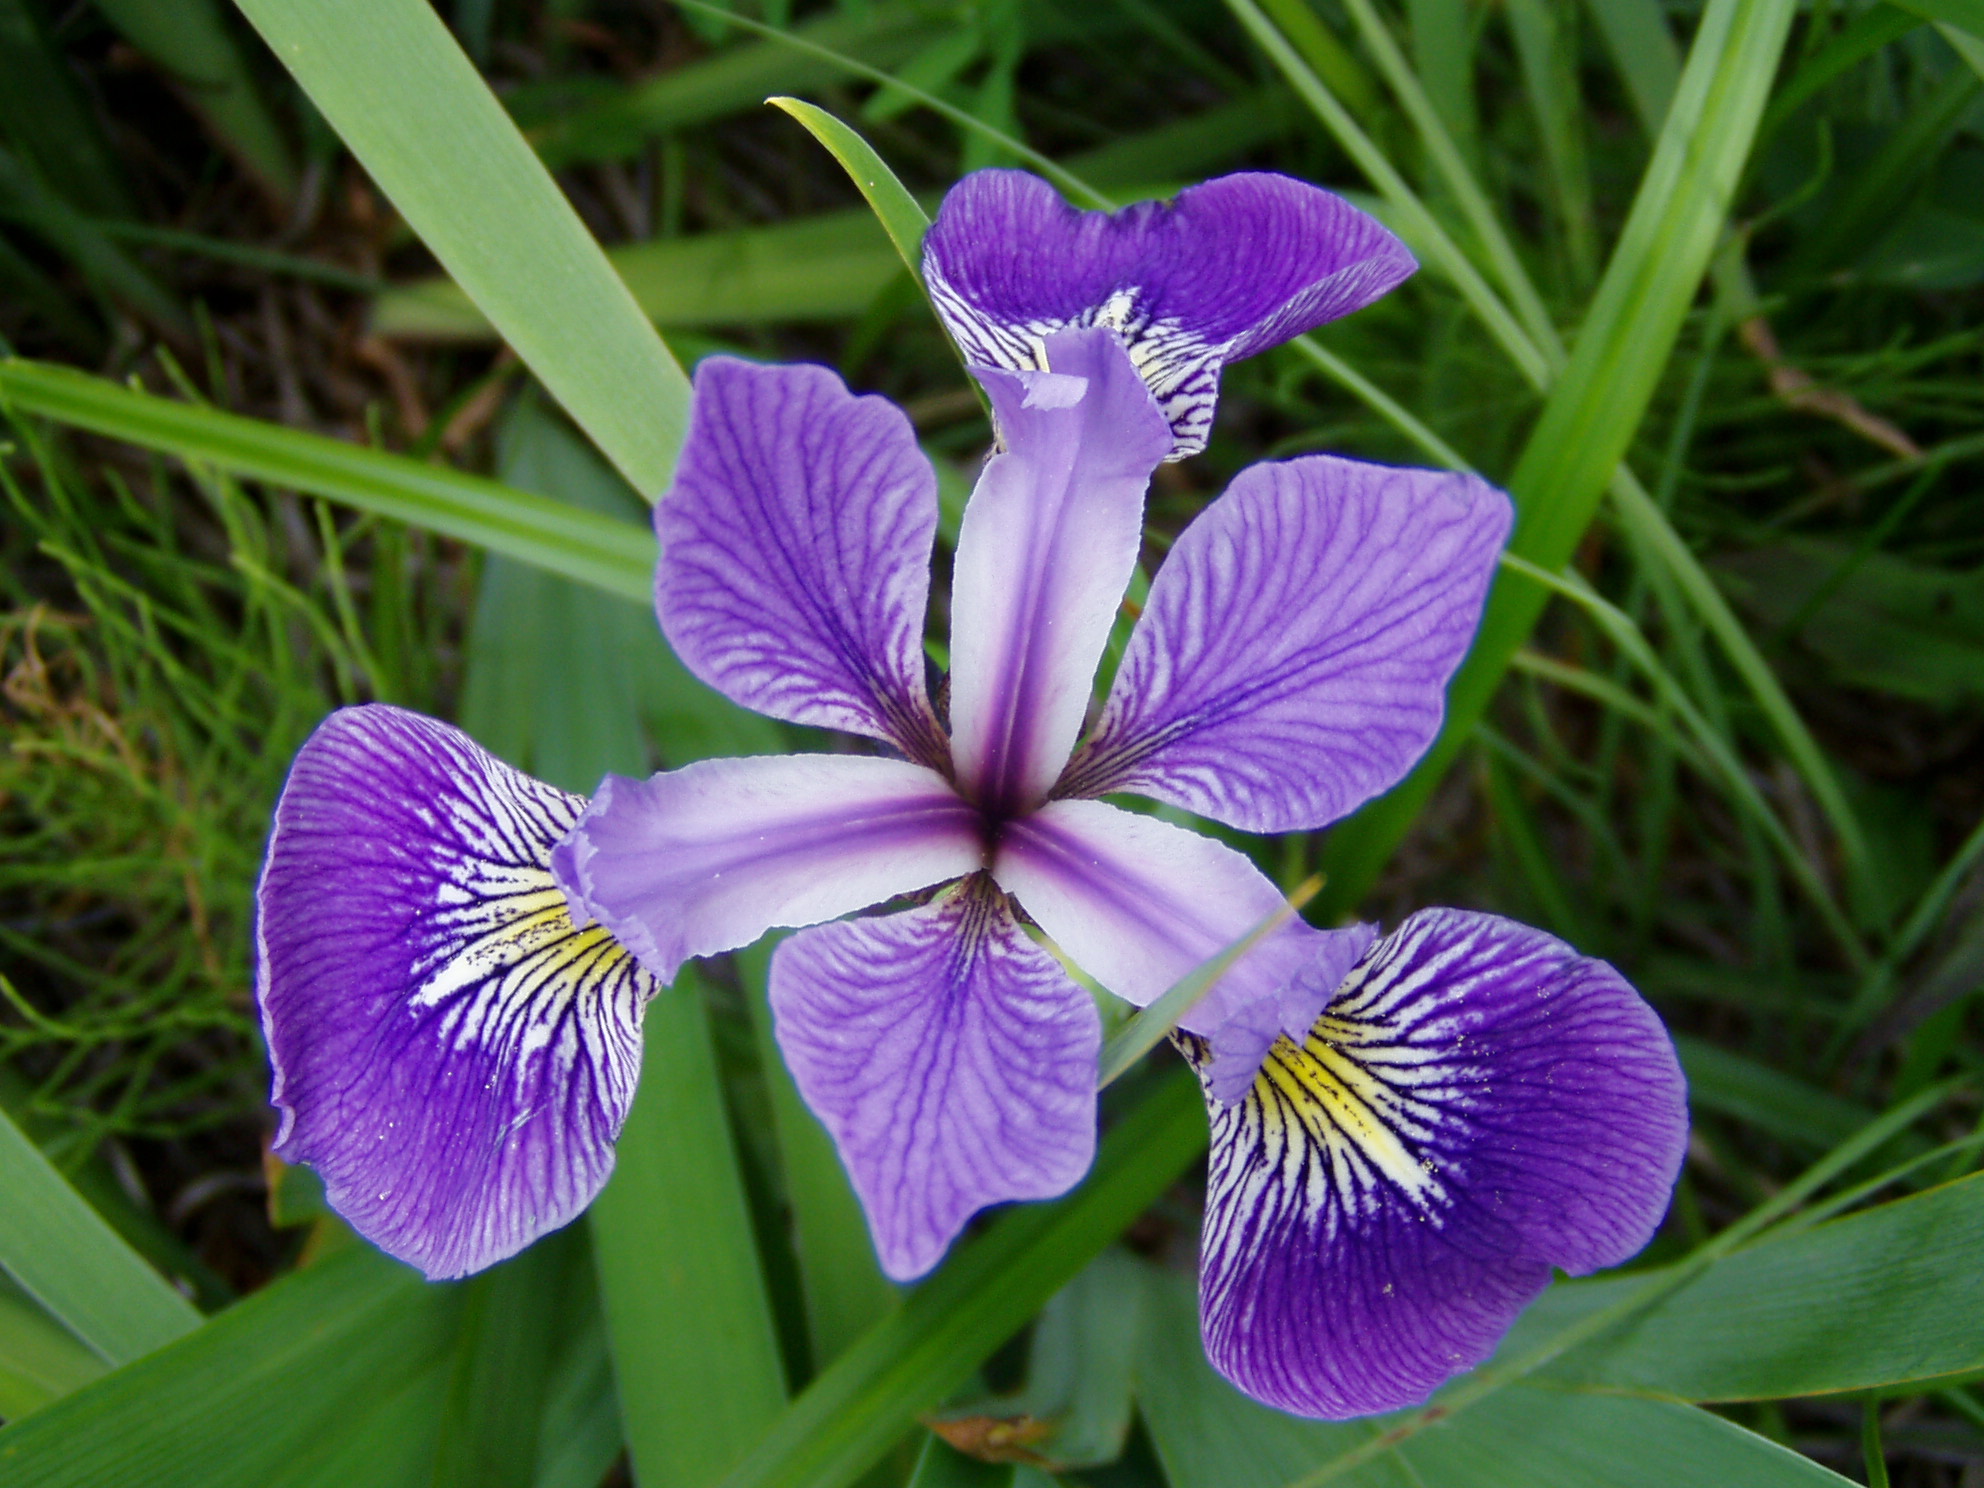 Iris Versicolor
 Iris Viginica
We have measurements of sepal & petal length and width.

How is a decision tree built?
Overview
- Make decision based on the feature data that splits the data into two subsets
- For each subset, make another decision that further splits the data
- When you reach small enough subsets where all data points that fall under one label, stop
How do we decide how to make the split?
- There are actually a number of ways to decide this
- entropy: a measure of randomness. what split will reduce entropy the most?
- If the sample is completely homogeneous the entropy is zero (lowest)
- If the sample is an equally divided it has entropy of one (highest)
- Works best for cleaner, low dimensional data sets
- Gini Impurity: a measure of homogeneity
- Works best for noisier, higher dimensional data sets
- As always, the best answer is arrived at experimentally: try both and see which works better.
When do we stop splitting?
- The goal is to find the smallest tree that fits the data.
- We reach a terminal node when a node cannot be split into further sub-nodes
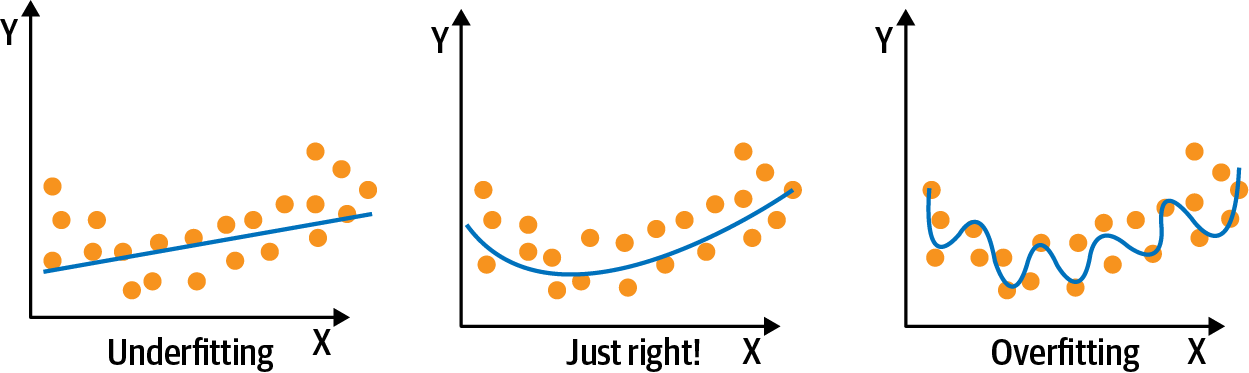
- The deeper your tree goes, the more likely you are to over-fit
- Specify a maximum depth can be a good way to stop a tree from growing too deep
- Pruning: chopping down the branches which consider features having low importance
Let's make a decision tree...
Random Forests
An advancement on decision trees
- The random forest algorithm is an example of an ensemble method
- Take
Nrandom samples from our training data and createmsubsets of data - Train
mindependent decision trees - For a given classification, each tree provides a classification and the final prediction is determined by voting
Basically, it’s a large number of Decision Trees making predictions that should be close to each other, yet not exactly the same.
Why bother to do this?
- Where one machine learning model can sometimes be wrong, the average prediction of a large number of machine learning models is less likely to be wrong.
- Random forest classifiers are more accurate than single decision trees
- Random forest classifiers are less prone to over-fitting than single decision trees
Bagging (AKA bootstrap aggregation)
- Bootstrap - data is created by resampling, with replacement.
- Aggregation - training multiple models (hyper-parameter: number of estimators)
- This reduces variance
- Bias is the error between the average model prediction and the ground truth
- High bias means the algorithm is missing important trends in the data.
- variance describes how much the estimate of the target function will alter if different training data were used
- High variance means the model won't generalize to anything beyond the training data
Classification metrics
- accuracy: correct predictions / total predictions
- confusion matrix: proportion of true positives, tre negatives, false positives, and false negatives
- FP and FN are also called Type-1 and Type-2 errors
Classification metrics continued...
- precision: % of positive identifications that was correct \[\begin{aligned} \frac{TP}{TP + FP} \end{aligned} \]
- recall: % actual positives that was correct? \[\begin{aligned} \frac{TP}{TP + FN} \end{aligned} \]
- Precision and recall can be a tug of war.
ROC Curves
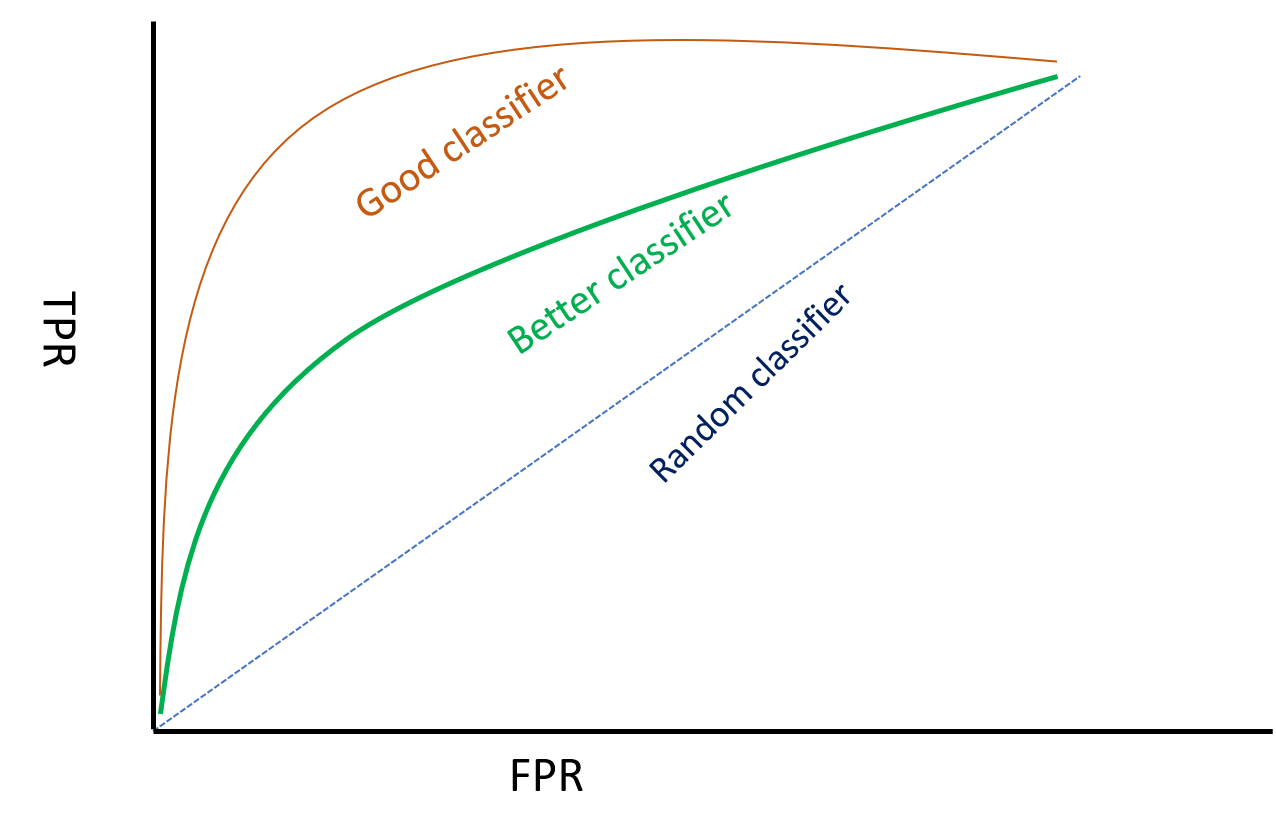
ROC Curves
- Only for probabilistic classifiers
- Probabilistic classifiers give a probability for a given class prediction
- Naive Bayes, Logistic Regression, SVMs