Exploratory Data Analysis
Announcements
- Assignment three is due
Wednesday, March 16
Exploratory data analysis
- Using statistics to analyze data sets and summarize their main characteristics
- Favors visual methods
- Usually a preliminary step to more complex approaches (like modeling, hypothesis testing, etc.)
- Looking at the data suggests hypotheses to test
- sometimes gets lumped in with "data mining"
Invented by John Tukey in the 1970s
The goals of EDA:
- maximize insight into a data set
- uncover underlying structure
- extract important variables
- detect outliers and anomalies
- test underlying assumptions
What's this got to do with Python? 
- It's a fantastic language to do EDA with.
- Has packages for:
- visualization: Seaborn, Bokeh, Matplotlib
- analysis: Pandas
- statistics: Statsmodels
- (fast) computation: Numpy
- science: SciPy, Astropy, Biopython, GeoPandas
- machine learning/AI: scikit-learn, TensorFlow, PyTorch
- explore/share/publish: Jupyter Lab
- Most of these integrate with each other.
Today, we'll look at and use two of these
- Seaborn you've seen
- Pandas for data analysis
- Jupyter Lab for "notebook" computing
Pandas 
- Library for doing data analysis (not just EDA) in Python
- Two concepts: DataFrame & Series (a.k.a table & column)
- Ubiquitous
- What it does:
- Importing from common file formats (like CSV & JSON!)
- Cleaning and reshaping
- Summarizing, grouping, & aggregating
- Joining with other data
- Plotting
pip install pandas
Jupyter Notebooks 
- Interactive data science/exploration environment
- Main concept: the "notebook"
- Combine text, code, and visualization in one place
- Share analysis colleages and coworkers
- Explore data quickly and easily in Python
- Integrates with Pandas and Seaborn seamlessly
- Work inside a web browser
pip install jupyterlab
Now that we've talked about tools,
let's get back to EDA!
Non-parametric summary stats
EDA relies on non-parametric summary stats
- Non-parametric methods do not follow any assumption regarding data's probability distribution.
- One can draw inferences and perform hypothesis testing without adhering to any assumptions.
- These are also more robust to outliers and skewed distributions (mean vs. median)
There's a reason EDA focuses on visualizing the data and not just computing descriptive statistics
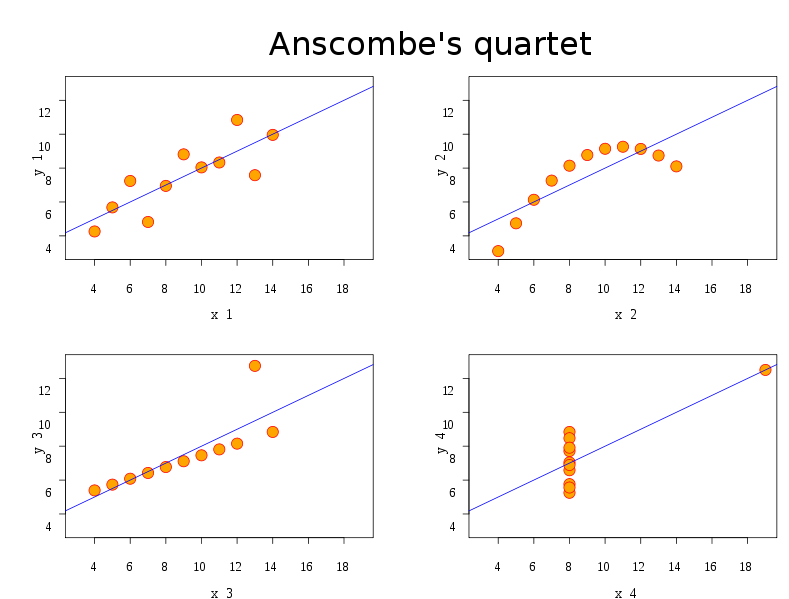
These four data sets have the same mean, variance, correlation, and linear regression coefficients!